Nuclear power systems contain many complex sequence failure behaviors due to standby redundant designs. Performing the risk assessment of sequence failure behaviors using dynamic fault trees can identify potential weaknesses of the nuclear power system so that preventive and mitigation measures can be effectively taken to improve the safety and economy of nuclear power plants.
Improving the calculation efficiency of dynamic fault trees for large complex standby redundant systems in nuclear power plants is the main challenge of current system probabilistic risk assessment studies.
A research team led by the associate Prof. GE Daochuan from the Hefei Institutes of Physical Science (HFIPS) of the Chinese Academy of Sciences proposed a rapid reliability analysis method for large complex standby redundant systems, which can effectively reduce the calculation time of system reliability.
The results were published in Reliability Engineering and System Safety.
The method was based on survival signature. The survival signature, which isolates system structure from probabilistic component information, has become a hot topic in reliability research because it improves system reliability analysis.
The researchers proposed employing component Boolean state vectors and conditions sample points to rapidly simulate the survival signature of standby redundant systems and to quickly calculate the dependability of complex standby redundant systems based on the generated survival signatures.
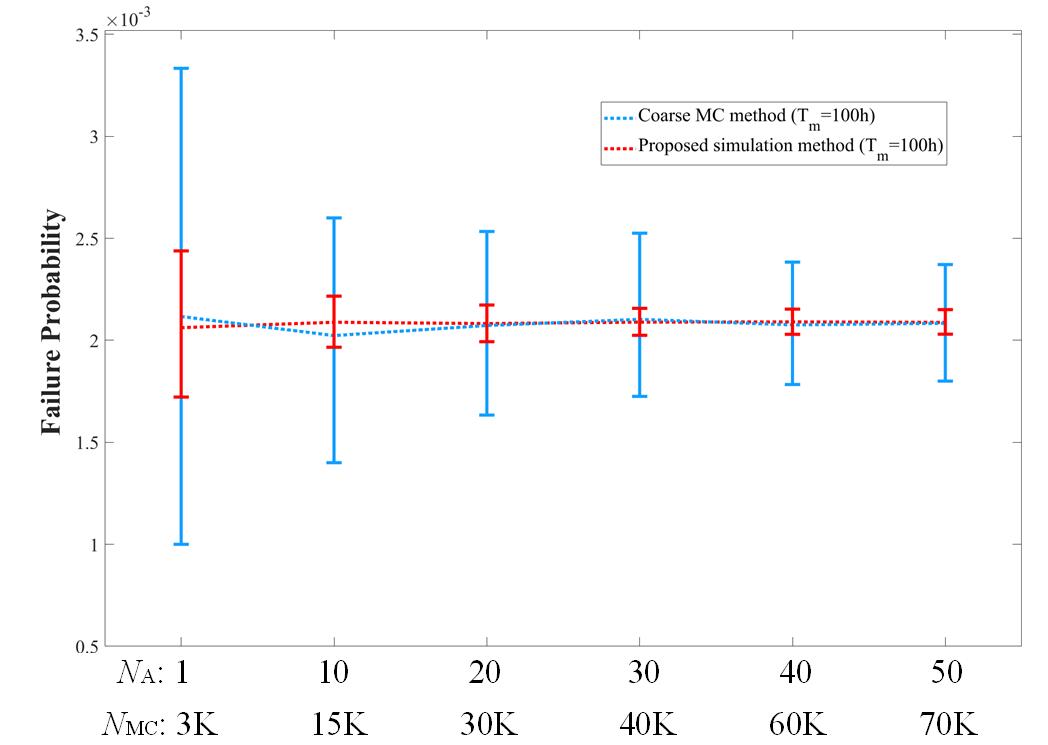
The results showed that the proposed method could effectively reduce the invalid sample points and sequence failure events of the simulation process for large complex standby redundant systems in real engineering. It was better than the traditional Monte Carlo method in terms of computational efficiency and accuracy.
"We hope our work might be some help for probabilistic risk assessment study," said GE Daochuan, who led the team.
The National Natural Science Foundation of China, the HFIPS Director’s Fund supported the research.

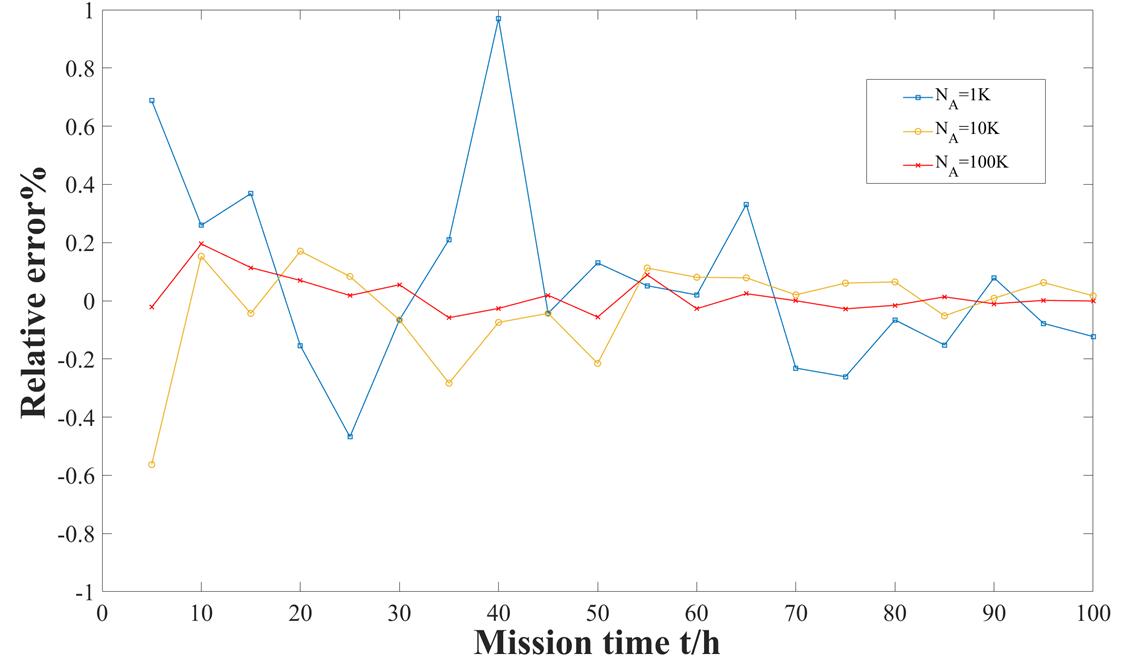
Fig. 1. Relative error of the proposed method at different simulation numbers. (Image by GE Daochuan)

Fig. 2. The confidence intervals (95%) of the Monte Carlo and proposed simulation methods (Image by GE Daochuan)