
Recently, a research group of Professor ZHANG Weijun from Anhui Institute of Optics and Fine Mechanics (AIOFM), Hefei Institutes of Physical Science (HFIPS) of Chinese Academy of Sciences (CAS), developed two virtually imaged phased array (VIPA) spectrometer and applied the near-infrared high-resolution spectrometer to measure the absorption spectroscopy of CO2.
The relevant research work was separately published in the journal of Analyst and Acta Optica Sinica.
Broadband and high-resolution spectroscopy allows for the simultaneous detection of multiple species, getting the relevant physical and chemical properties and plays an important role in many scientific research and application such as precision measurement and atmospheric monitoring. However, there is always competition between spectral coverage and high resolution of traditional spectrometers. The VIPA developed in recent years offers an opportunity to solve this problem with a compact structure.
In this research, the team developed two VIPA spectrometers. One realized a spectral coverage of 20 nm at the central wavelength of 660 nm and a high resolution of 1.4 pm and another one realized a spectral coverage of 25 nm at the central wavelength of 1.4 μm and a high resolution of 4.5 pm.
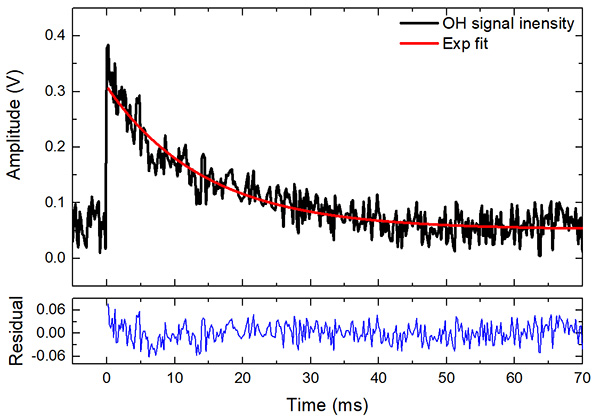
Then the researchers applied the near-infrared VIPA spectrometer to measure the absorption spectroscopy of CO2 and achieved high-accuracy spectral reduction based on the HITRAN database. The measured data were consistent with the simulated spectra, which proves the accuracy of the developed VIPA spectrometer and the reliability of the spectral reduction and spectral fitting algorithm.
The device has important application prospects in the fields of atmospheric trace detection, precision measurement and basic physical and chemical research.
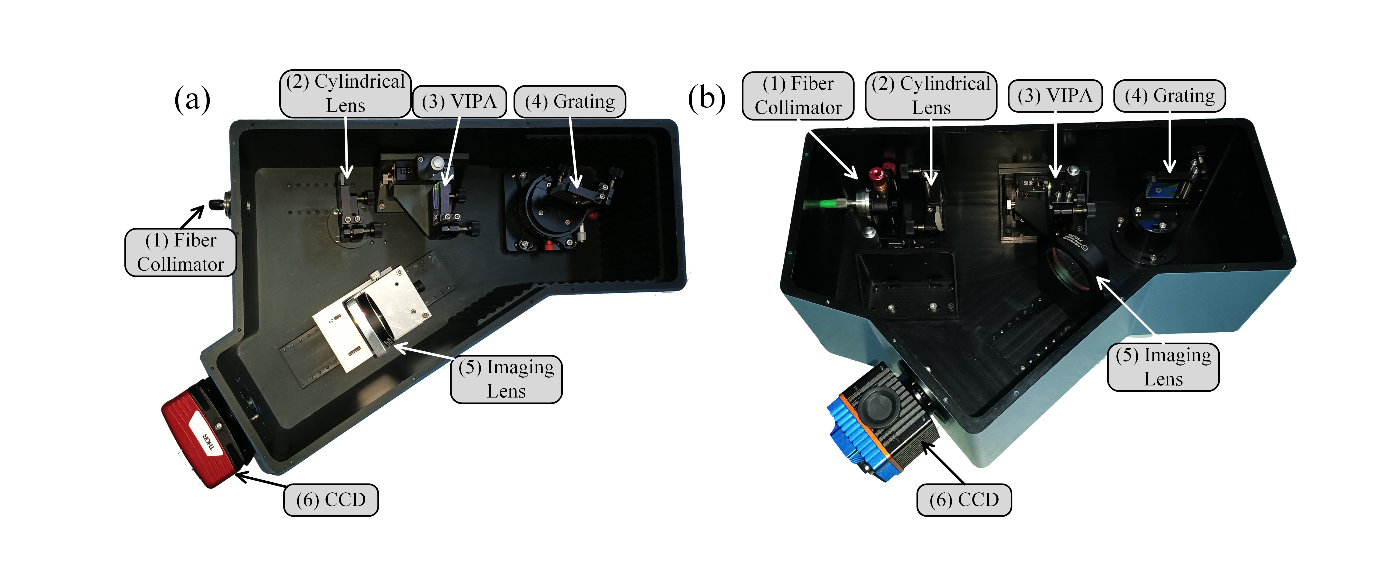
Figure 1. The setup of VIPA spectrometers (a) visible band; (b) near-infrared band. (Image by ZHOU Hao)

Figure 2. The absorption spectrum of CO2 in the near-infrared. (Image by ZHOU Hao)